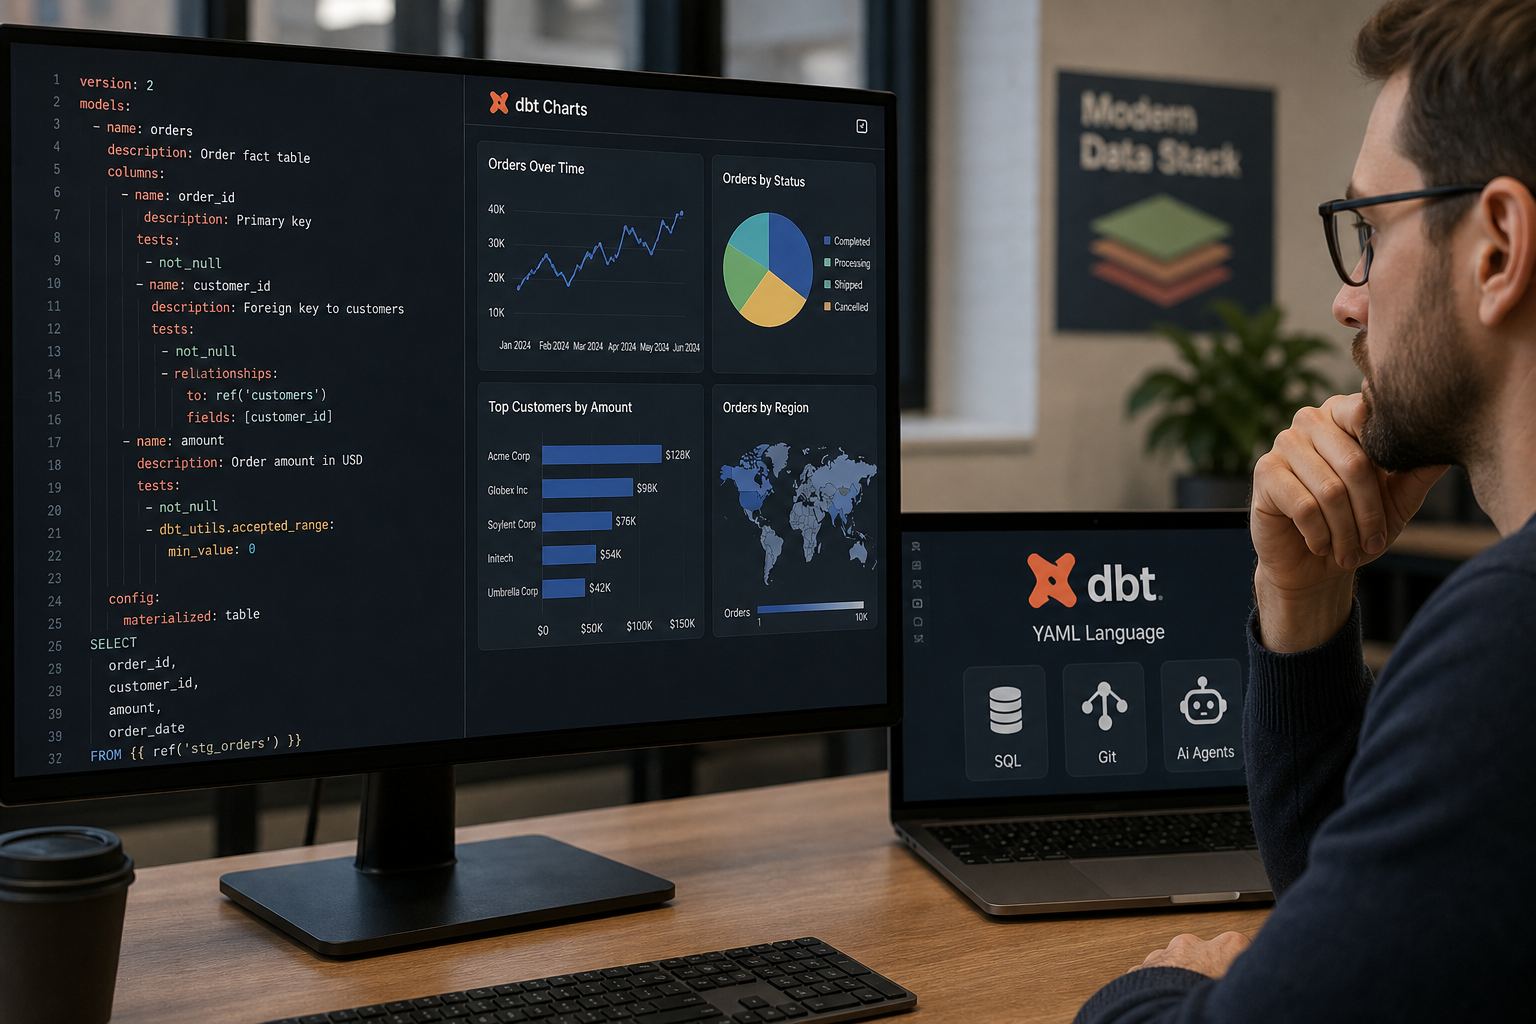
The long-promised self-serve analytics has finally arrived, and it's changing the face of data analysis. With the introduction of dbt Charts, a new open-source language, charts are being pulled out of BI tools and put into code. This move is set to revolutionize the way we work with data, making it easier for humans and AI agents to collaborate and build together.
According to Tristan Handy, founder of dbt Labs, the modern data stack has undergone significant changes in recent years. The infrastructure layers of the traditional BI bundle have been pulled out and turned into purpose-built infrastructure, leaving BI tools to focus on visualization, interactive analytical interfaces, and semantic definitions. However, this has also created a new set of challenges, particularly when it comes to working with AI agents.
AI agents are fluent in code, SQL, and Git, but struggle with UI-based tools. dbt Charts addresses this issue by introducing a new structured YAML language that can declare a full interactive dashboard in one auditable YAML file. This means that chat agents can now work seamlessly with data, creating charts and dashboards with ease.
The dbt Charts language is designed to be extensible and easy to read, with a focus on simplicity and flexibility. It wraps SQL in YAML, allowing users to declare what data they want to see and how they want to see it. The language also includes support for Markdown and Jinja, making it easy to add prose and variables to charts.
One of the key benefits of dbt Charts is its deep integration with dbt. The chart layer sits directly on the transform layer, making it easy to change both models and charts in a single Git repo. This integration also enables support for the dbt Semantic Layer, allowing boards to use metrics as defined in the project instead of restating SQL.
dbt Charts also includes a range of features designed to support conversational analytics, including strict validation of YAML and SQL, and an extensive set of visualization checks. These checks flag potential problems before anyone sees the board, making it easier to identify and fix issues.
In addition to the open-source language, dbt Charts is also launching a hosted platform, dbtCharts.com, in public beta. This platform connects to your warehouse and adds conversational analytics, a visual editor, version history, and sharing with permissions for users and groups. The platform is designed to handle the hosting, access control, and UI aspects of BI, leaving the open-source language to focus on the chart layer.
With dbt Charts, teams can self-serve, agent in hand, without creating a second, hidden data stack. The platform is built on the open language, so every change, from chat, the visual editor, or code, lands in the same YAML in your Git repo. This means that nothing is locked in, and the same board can run on your laptop, in CI, and on the platform.
Este artigo foi escrito com a assistência de IA.
News Factory APP - notícias agênticas para impulsionar seu SEO e AEO.