If you're running a small business, your weekly analytics ritual probably looks like this: log in to Google Analytics 4, stare at the dashboard, feel slightly worse about life, log out. Five tabs into the side menu and you still don't know whether last week was a good week. Then you open Google Search Console and the numbers don't even match GA4 — so which one is wrong? Both? Neither?
Here's the secret nobody selling you a $99/month analytics course wants to admit: you only need six reports to know exactly what's working on your site, what to fix, and what to double down on. Not sixty. Not the seventeen-page "comprehensive SEO audit" template a freelancer charged you for. Six. They live across GA4 and Search Console, and the cleanest way to look at them is one combined Looker Studio page that takes about thirty minutes to set up.
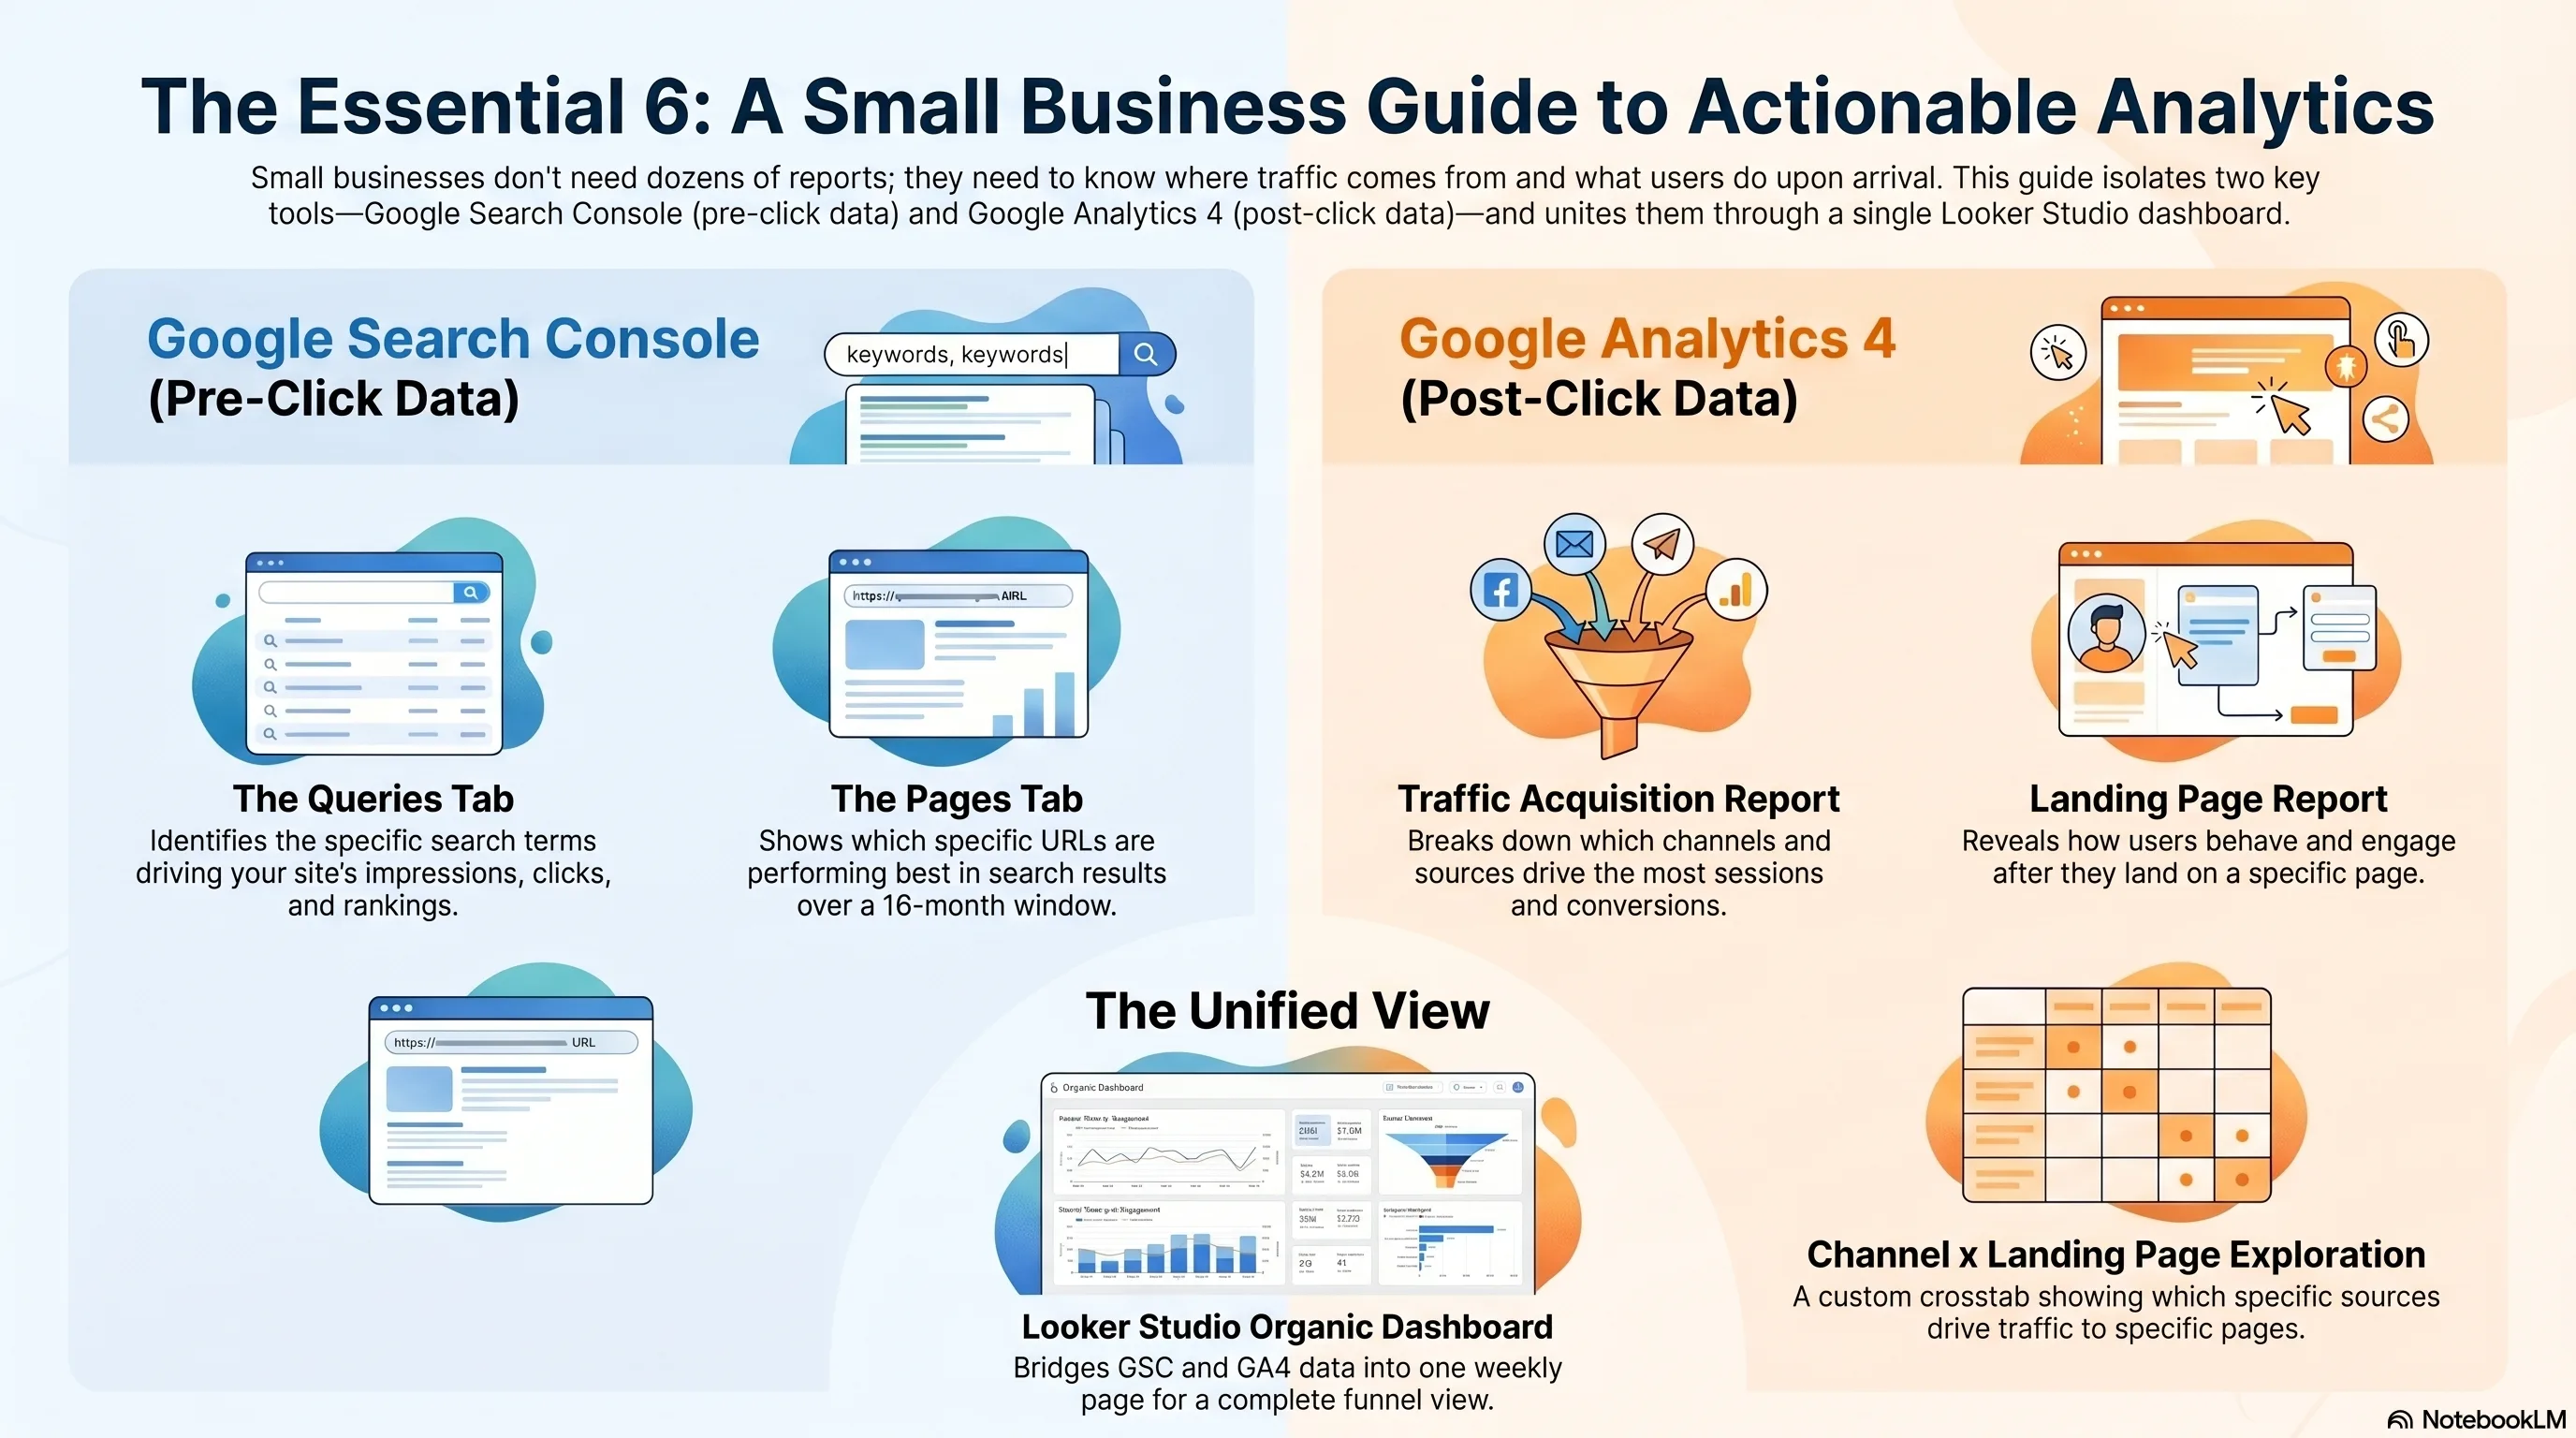
This is the dashboard. We'll walk through which six reports matter, why two of them are in Search Console and four are in GA4, how to join them in Looker Studio using Google's own free template[1], and how to read the result without falling into the four classic small-business analytics traps — Sessions vs Users confusion, the GSC-clicks-don't-match-GA4-sessions panic, keyword cannibalization that nobody told you about, and pages that quietly decayed while you were doing other work. Every section ends with a one-line "do this now."
Why 6 Reports, Not 60
The two questions a small business analytics setup actually has to answer
GA4 has roughly 27 pre-built reports and an unbounded number of Explorations you can configure yourself. Search Console has another dozen surfaces — Performance, Pages, Sitemaps, Indexing, Core Web Vitals, Links, the lot. The full menu is a perfectly good resource for a 12-person SEO team. It is wildly excessive for a business owner who has 45 minutes on a Monday morning to figure out what to do this week.
The reframe that fixes this is brutally simple. Your dashboard only has to answer two questions:
- Where is my traffic coming from, and is it growing or shrinking? (Channel, query, landing page.)
- Once people arrive, are they doing the thing I want? (Conversion, engaged session, sale, lead.)
That's the entire job. Every other "report" is either a deeper dive into one of those two questions or a vanity number. Pageviews-per-session is a vanity number. Average engagement time is a vanity number. Bounce rate — which Google deprecated as a primary metric in GA4 for exactly this reason — is a vanity number unless you're a publisher monetising on impressions.
The whole framework in one line
→ Do this now: Open GA4 and Search Console side-by-side in two tabs. If both work, you have the entire data foundation you need. If GSC isn't linked to GA4 yet, do that first (GA4 → Admin → Search Console links) — without it, the next six steps won't work.
The Six Reports That Actually Matter
Two in Search Console, three in GA4, one in Looker Studio — total weekly review: 15 minutes
Here is the entire reporting surface a small business needs. Six reports, each answering exactly one question, no overlap. Memorise the menu paths — you'll be on them every Monday for the next decade.
| Report | Tool | What it answers | Cadence |
|---|---|---|---|
| Performance → Search results (Queries tab) | GSC | Which search terms are actually bringing you visitors right now — and where you rank for each. | Weekly |
| Performance → Search results (Pages tab) | GSC | Which pages are pulling search traffic, what their average position is, and which ones are decaying. | Weekly |
| Reports → Acquisition → Traffic acquisition | GA4 | Which channels (organic, paid, direct, referral, social) drive sessions, engaged sessions, and conversions. | Weekly |
| Reports → Engagement → Landing page | GA4 | Which entry pages turn search clicks into conversions — your real ROI per URL. | Weekly |
| Explore → Free-form: Channel × Landing page × Conversions | GA4 | The crosstab GA4 hides by default: which organic landing pages convert vs. which just collect visits. | Monthly |
| Looker Studio — combined organic dashboard | Looker Studio | GSC clicks + impressions + position joined with GA4 sessions + conversions on one weekly page. | Weekly review |
GSC: Performance → Search results (Queries + Pages)
The Performance report is the one Search Console screen that justifies the entire login. Open it, switch between the Queries tab and the Pages tab, and you have everything: which searches show your site (impressions), how often searchers click (clicks), where you rank on average (position), and the click-through rate that ties the three together.[9] The Pages tab is the same data sliced by URL instead of query. Both tabs allow a 16-month date window — the longest historical view of search behaviour Google gives you for free.
Two practical filters change how useful this report is overnight. First, toggle the date comparison to "compare last 28 days to previous 28 days" — you instantly see which queries gained, lost, or held position. Second, in the Pages tab, sort by impressions descending and look for any row where position is between 8 and 20 with high impressions. Those are pages one good edit away from page-one traffic.
→ Do this now: In GSC Performance, set the date filter to "Compare last 28 days." Sort the Queries tab by Clicks (descending). Screenshot the top 20 — that's your true "what's working" list for this month.
GA4: Reports → Acquisition → Traffic acquisition
This is the GA4 report that replaces the now-deprecated Universal Analytics "Source/Medium" view that everyone built their muscle memory around. Reports → Acquisition → Traffic acquisition gives you the seven channels GA4 auto-classifies — Organic Search, Paid Search, Direct, Organic Social, Paid Social, Referral, Email — with sessions, engaged sessions, conversions, and revenue side-by-side. For a small business this is the single most useful GA4 screen, period.
The trick most operators miss: change the primary dimension dropdown from "Session default channel group" to "Session source / medium" and you'll see the raw breakdown — google / organic, bing / organic, chatgpt.com / referral, linkedin.com / referral. The grouped view hides where ChatGPT, Perplexity, and Claude referrals are landing in 2026, which is increasingly where small-business B2B traffic actually originates.
→ Do this now: In GA4 Traffic acquisition, switch the primary dimension to "Session source / medium." Note your top five real referrers. If "chatgpt.com" or "perplexity.ai" is anywhere in your top 10, that's a 2026 signal — write more content about whatever you do, because LLM citation is starting to drive your traffic.
GA4: Reports → Engagement → Landing page
This report is the post-click answer to GSC's pre-click Pages tab. Same URLs, different question: of the people who landed here from any source, how many converted? Sort by Conversions descending and you have your high-ROI URL list. Sort by Sessions descending with Conversions roughly equal to zero and you have your "high traffic, no business outcome" problem list — which is usually your biggest content-strategy fix.
→ Do this now: In Landing page, find the page with the most sessions and zero or near-zero conversions. That page is either missing a CTA, missing a relevant offer, or attracting the wrong audience. Pick one and fix it this week.
GA4 Exploration: Channel × Landing page × Conversions
GA4's Explorations module is the bit nobody opens because the UI is genuinely intimidating. Push past it — the crosstab below is worth the friction. Go to Explore → Blank → drag Session default channel group into Rows, Landing page into Rows below it, and Sessions, Conversions, and Session conversion rate into Values. Filter to channel = "Organic Search." Save the exploration as "Organic landing pages — conversion view."
What this shows you that no other report does: which organic landing pages actually convert, ranked. Three pages might pull 80% of your organic sessions; one of them probably also pulls 80% of your organic conversions, and it might not be the same one. The mismatch is the entire reason this view exists.
→ Do this now: Build that exploration once. Save it. Re-open it every month — it auto-updates with fresh data, you don't have to rebuild it.
GSC clicks vs GA4 sessions — the typical reporting gap for organic traffic
gscdump.com + metricsrule.com 2025–2026 — the gap widens with consent laws, ad-block, and privacy-browser usage[3][4]
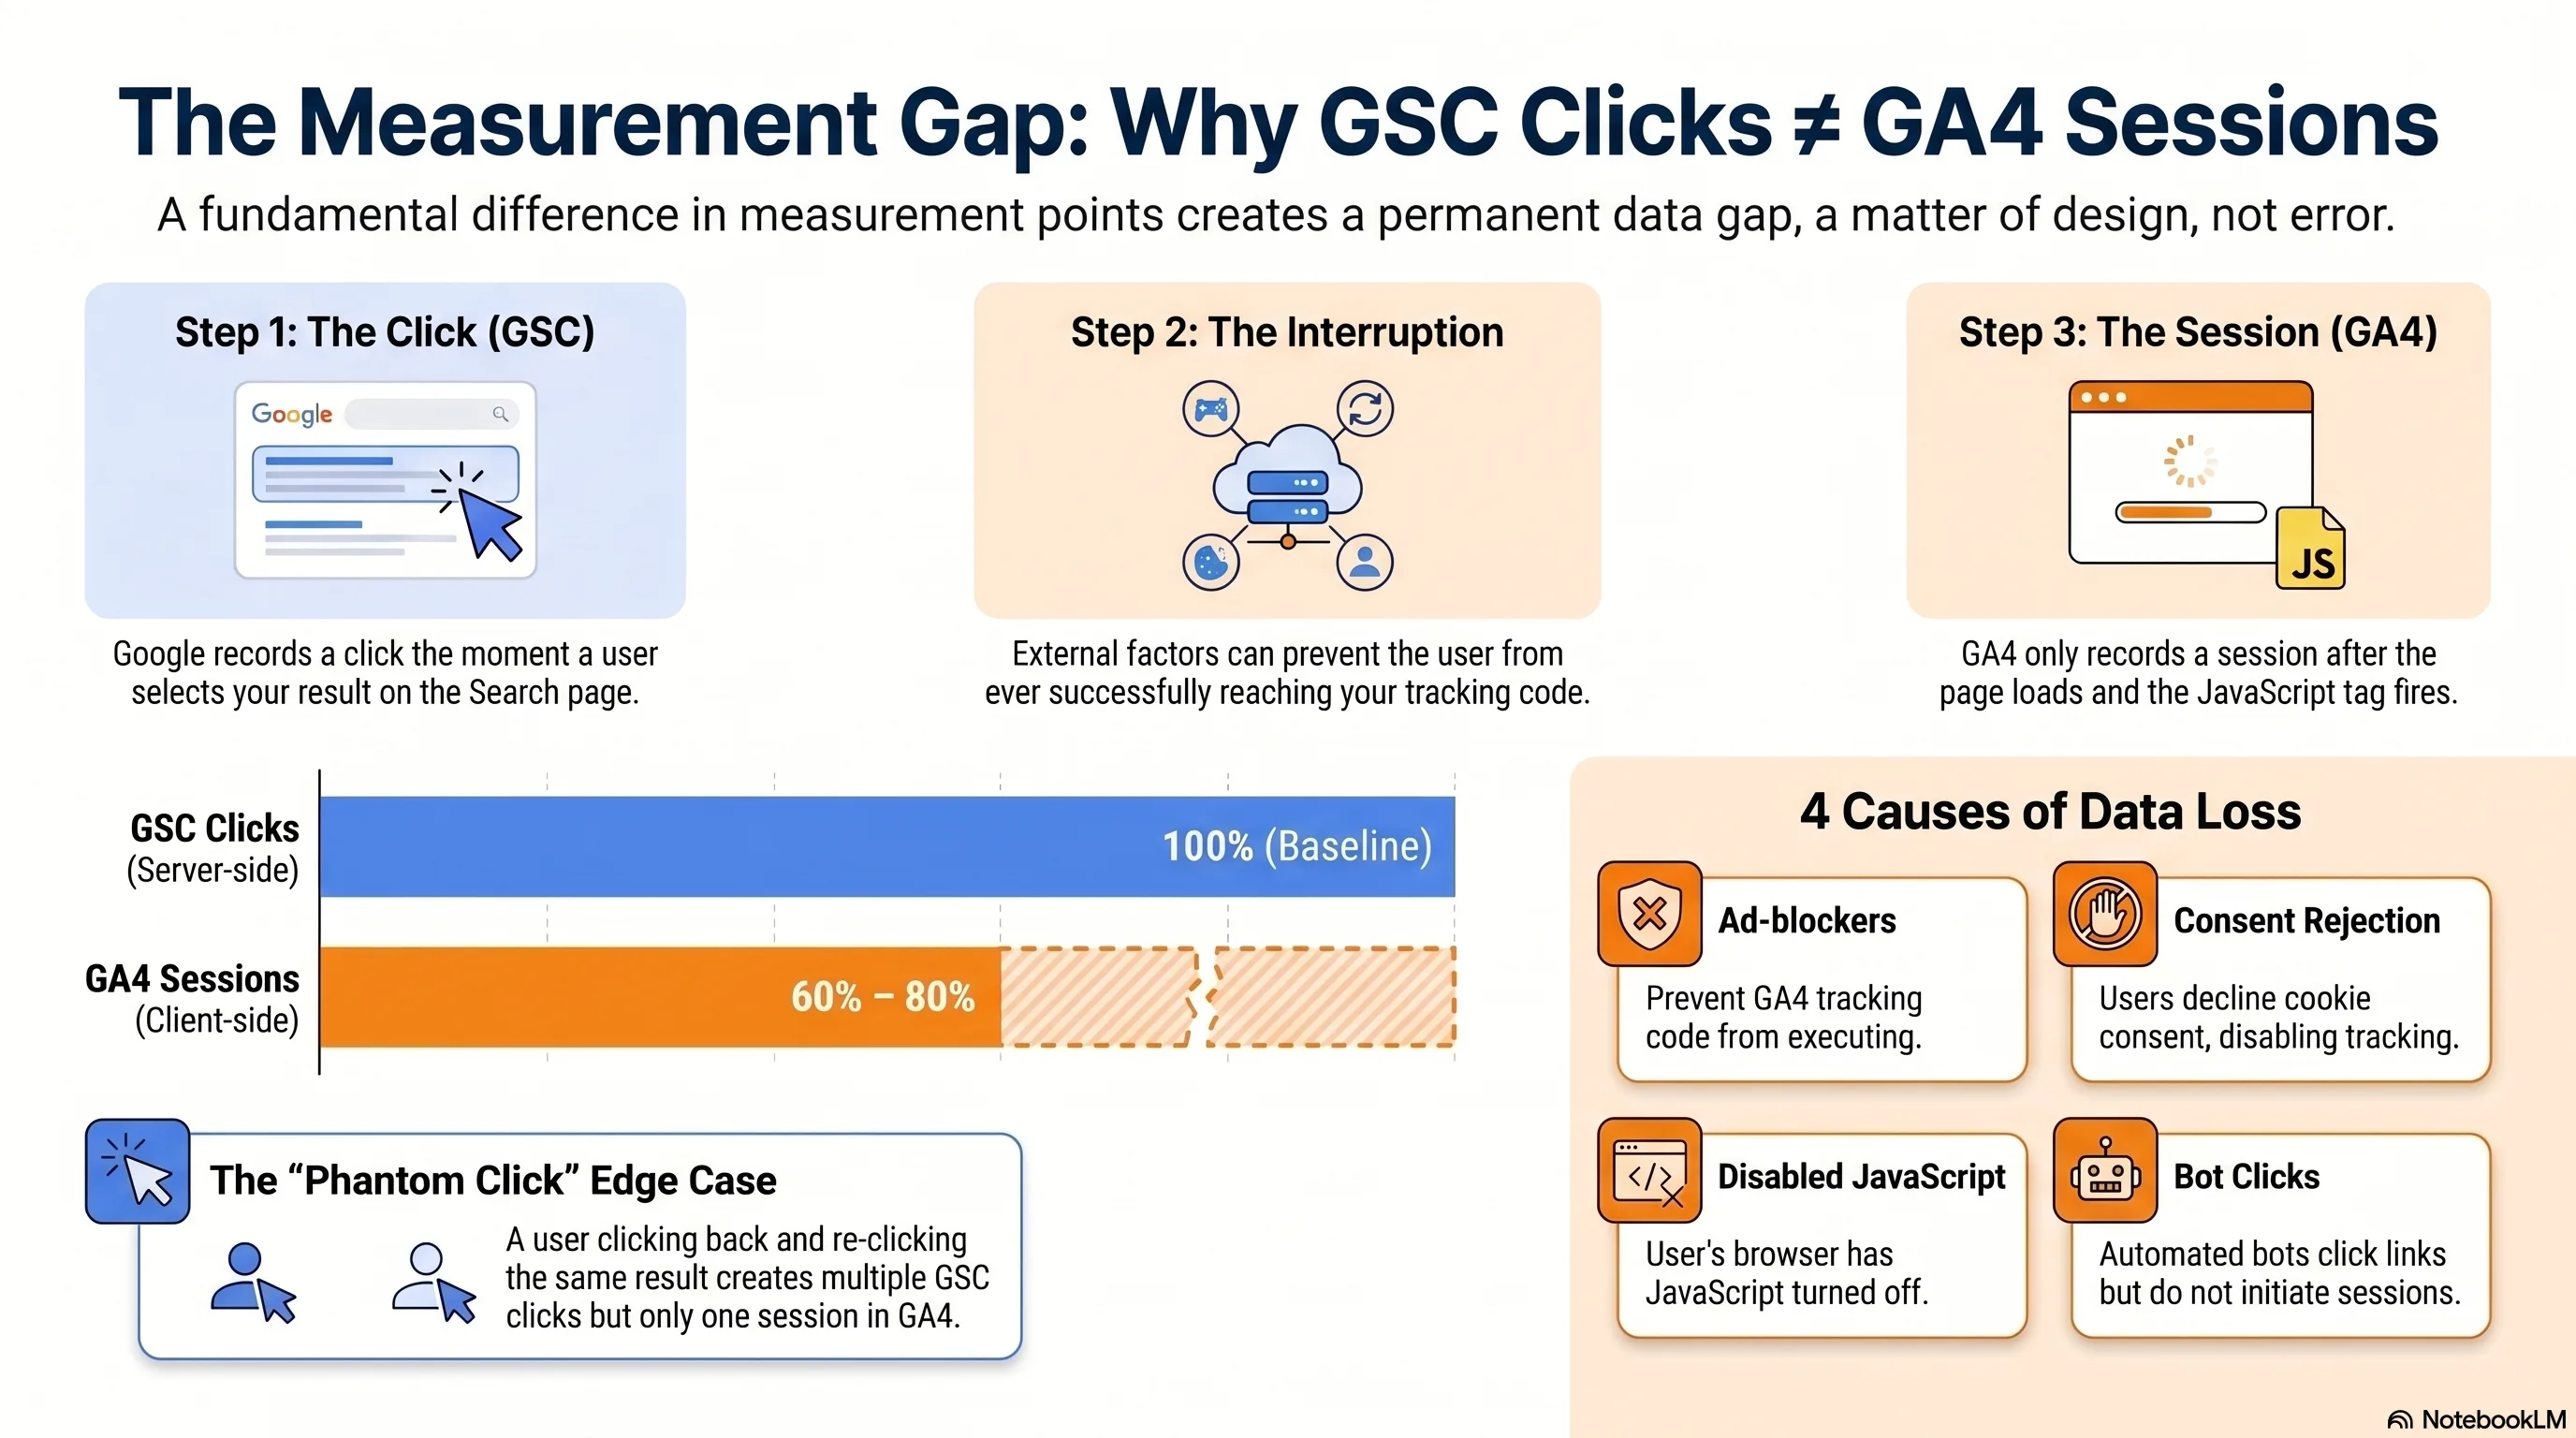
If GSC says 1,000 clicks and GA4 shows 700 sessions, that's a healthy 30% gap — not a bug. If the gap is 80%+, look at your consent management, ad-block-heavy audiences, and EU traffic share before assuming GA4 is broken.
Combining GSC + GA4 in Looker Studio (Free Template Included)
One dashboard, two data sources, thirty minutes to wire up forever
Looker Studio is Google's free reporting layer. It is the only place you can put GSC and GA4 data on the same page without writing code. Google publishes an official template specifically for this purpose — the Search Console + Google Analytics dashboard template[2] — and it is honestly excellent. Don't pay anyone $200 for a "custom small-business analytics dashboard." Use this one.
The setup is mechanical, not technical:
- Open the official template at the link above.
- Click "Use my own data." Looker Studio will show errors next to every chart — that's expected.
- Connect the GSC data source: pick your verified property and choose the URL Impression table (not Site Impression — URL gives you per-page breakdowns).
- Connect the GA4 data source: pick your GA4 property.
- Walk down the chart panel; each chart has a "Data" tab — point it at the right source. The template guides you.
- Save, name it ("Weekly SEO Dashboard — [Business Name]"), and bookmark it.
The template uses orange for GA4 data and blue for GSC data throughout, so you always know which tool a number came from at a glance. The GA4 portion is pre-filtered to Session source = google and Session medium = organic — exactly the slice that should match GSC. Everything else in your GA4 (paid, direct, social) is filtered out by design.
What the dashboard tells you in 90 seconds
→ Do this now: Open the template, click "Use my own data," and start the connect-data wizard. If you finish nothing else from this article, finish this — total time is ~30 minutes and you'll thank yourself every Monday.
Common Confusions (Sessions vs Users, GSC ≠ GA4, and the Rest)
The six gotchas that have wasted more small-business hours than any other analytics topic
These are the questions every small-business owner asks within their first month of looking at GA4 and Search Console seriously. The answers are all "it's by design, not a bug," but the design choices are non-obvious enough that operators repeatedly assume something is broken when nothing is.
“Sessions” vs “Users” in GA4 — and which one is the right denominator
HighA session is one visit (30-min inactivity window). A user is one person who can have many sessions. Conversion rate divides conversions by sessions (per-visit) or by active users (per-person). They answer different questions; both can be ‘the right answer’ depending on whether you care about a campaign’s efficiency or a person’s likelihood to buy.
GSC clicks never equal GA4 sessions — and that’s by design
CriticalGSC counts a click the moment a user taps your SERP result, server-side, before your site loads. GA4 counts a session only after its JavaScript fires. Ad blockers, slow page loads, consent rejection, and the back-button-then-reclick pattern guarantee a permanent ~20–40% gap. Daniel Waisberg (Google) confirmed at Search Central Zurich 2024 the two will rarely align — by design, not error.
“(not provided)” / missing queries in GA4
HighGA4 doesn’t see search queries at all — Google stopped passing query strings to Analytics years ago. Use GSC for the query, GA4 for what the visitor did after they landed. Treat them as before-the-click vs after-the-click, not as ‘two views of the same number.’
GSC ‘anonymized’ queries — 46% of clicks have no label
MediumPatrick Stox (Ahrefs) found ~46% of total GSC clicks are bucketed under hidden ‘rare queries’ for privacy. The implication: never base a strategy on the top-100 visible queries alone — at least half the iceberg is below the waterline.
Timezone drift — GSC is Pacific, GA4 is whatever you set
MediumGSC is locked to Pacific Time. GA4 is in your property’s timezone. A click at 23:55 PT becomes a session at the next-day timestamp in your local GA4 — daily comparisons will jitter ±1 day. Compare 7- or 28-day totals, not single days.
Canonical URL attribution
MediumGSC assigns clicks to the canonical version of a page. If your canonical points elsewhere (mis-set rel=canonical, AMP, country variants), the URL you’d expect to see in GSC has zero clicks while a different one shows them all. Always cross-check the canonical before debugging a ‘missing traffic’ panic.
The most important one is the GSC-clicks-don't-equal-GA4-sessions confusion, because it's the one most likely to make you doubt your entire setup. The mechanic is simple: GSC counts a click before your site loads (server-side, inside Google's infrastructure), while GA4 counts a session after the page loads and the JavaScript tag fires.[3] A user with an ad blocker, a slow connection, or a Brave/Firefox-with-tracking-protection browser will register as a GSC click and zero GA4 sessions. The back-button-and-reclick pattern guarantees one GSC click pair maps to one GA4 session every time. The official Google position, stated by Daniel Waisberg (Google's Search Advocate) at Search Central Zurich 2024: the two will rarely align — by design, not error.[4]
The practical rule: expect a permanent 20–40% gap for most sites, more if your audience skews European or technical (heavier ad-block / privacy-browser use). If your gap is consistently smaller than ~15%, you probably don't have a Consent Management Platform installed and your GA4 setup is non-compliant in regions with GDPR-equivalent law. If it's consistently larger than ~60%, something is probably broken — either your tracking tag, your consent banner is defaulting to deny, or you're being heavily bot-hit on GSC.
→ Do this now: Pull last month's GSC clicks (Performance → Search results) and GA4 sessions filtered to organic-google. Compute (GSC − GA4) ÷ GSC. Anything between 20% and 40% is normal; outside that range, audit your tracking tag firing before you change strategy.
Spotting Keyword Cannibalization in GSC (in Five Minutes)
Two of your pages competing against each other in the same query — and how to fix it without a developer
Keyword cannibalization is the polite term for "two pages on your own site fighting each other to rank for the same search." Google can usually only show one URL per domain per query, so when you have two near-duplicates, three things happen at once: PageRank dilutes between them, the click-through rate drops because the displayed URL keeps swapping, and Googlebot wastes crawl on near-duplicate pages. None of these are catastrophic individually; together they can keep a perfectly good page stuck on page two indefinitely.
The five-minute detection method, adapted from the 2026 GSC-driven audit playbook:[6]
- GSC → Performance → Search results. Set the date range to 16 months (the maximum).
- Click any query in the top list. Then click the Pages tab inside that drilldown — you'll see every URL that's received impressions for that exact query.
- If two or more URLs each have ≥10 impressions for the same query, you have a cannibalization candidate.
- Open both URLs in incognito tabs. Ask yourself: do these two pages serve the same intent? If yes → fix. If no → false positive, ignore.
Once you've confirmed a real case, the decision matrix below covers every realistic fix. You don't need a developer for any of them — they're WordPress / Webflow / Shopify dashboard tasks for most small businesses.
| Situation | Action | Implementation |
|---|---|---|
| Both pages low-performing, full intent overlap | Merge | Consolidate content into one page, 301-redirect the loser to the winner. |
| One strong page, one weak page, full overlap | Canonical | rel="canonical" on the weak page pointing to the strong one. Don’t delete — let it pass authority. |
| Weak page is a filter/parameter or thin variant | Noindex | Meta robots noindex + remove from sitemap. Leave internal links to it intact for navigation. |
| Partial overlap — both have a real, distinct audience | Differentiate | Rewrite titles and H1s along intent lines (informational vs transactional). Update interlinks to match. |
| Internal-link anchor imbalance | Re-link | Audit anchor text (Screaming Frog / Sitebulb). One anchor → one target. 38% of cannibalization cases trace back to this alone. |
The data point worth internalising: in seoaraci.com's project sample, the average click-through rate lift on affected queries four weeks after a properly executed cannibalization audit was +22%.[6] For a page sitting at position 4–6 averaging 1,500 monthly impressions, that's an extra 150–250 clicks a month, every month, with zero new content written. The fix is almost always cheaper than writing a new post.
→ Do this now: Pick your top 5 most important queries in GSC. Click each, switch to Pages tab. If any query shows two URLs with ≥10 impressions, you have a cannibalization case. Pick the worst one and apply the decision matrix this week.
Identifying Decaying Pages Before They Cost You
The five-minute GA4 + GSC query that surfaces every page quietly losing traffic
Content decay is the slow, often-unnoticed decline of pages that used to rank well. The Animalz writeup on decay is the canonical reference here[10], and the punchline is that most of your traffic loss in any given quarter comes from existing pages decaying, not from new pages failing. The standard mistake is to respond by writing more new content, when refreshing five old posts would recover the same traffic in a fraction of the time.
The detection method takes two passes — one in GSC, one in GA4 — and finishes in under five minutes:
Pass 1 — GSC: Pages tab, 28-day comparison
GSC → Performance → set the date filter to "Compare: last 28 days to previous 28 days." Switch to the Pages tab. Add a Difference column by clicking the column header. Sort by Clicks difference (ascending — most negative at the top). Any page with a Clicks delta of −25% or worse, and ≥100 monthly clicks at baseline, is on the decay list.
Pass 2 — GA4: Landing page, same comparison
GA4 → Reports → Engagement → Landing page → comparison: last 28 days vs previous 28 days. Sort by Sessions descending, filter to organic-google. Any URL down 25%+ session-on-session matches the GSC list confirms the decay. If GSC and GA4 disagree (decay in one, flat in the other), the truth is usually GSC — GA4's measurement is more easily distorted by tag firing and consent rejection at low volumes.
- Information staleness. The original ranked because it had 2024 stats; it's now 2026 and competing posts have fresher numbers. Fix: republish with current data, update the published date, refresh internal links to it.
- SERP feature creep. A featured snippet, AI Overview, or People Also Ask box now occupies space your result used to. Same position, fewer clicks. Fix: rewrite the intro to directly answer the question the SERP feature is answering badly.
- Cannibalization. You published a newer post that's stealing impressions from the older one. See the section above — this is the highest-ROI fix in most cases.
- Backlink loss. A page that earned links has lost some (sites died, links removed, redirect changes). Fix: check Search Console → Links → External; reach out about broken / removed links.
→ Do this now: Open GSC Pages tab, set the 28-day comparison, sort by Clicks difference ascending. The top three rows are your refresh list for next week. Update one per week. You'll see those clicks come back within four weeks roughly half the time.
2026 Context: How AI Overviews & SGE Traffic Show Up in GA4/GSC (or Don't)
The single biggest reporting change of the last two years — and the honest answer about how to track it
If you've felt like your search traffic curve has flattened or dipped in the last 12 months while your rankings stayed roughly the same, you are almost certainly seeing the AI Overviews effect. Google's AI-generated summary at the top of many SERPs answers the query directly — the user gets their answer, the click doesn't happen, your impressions stay high, your clicks decline.
Pew Research published the cleanest study to date in July 2025. They tracked 900 US adults' browsing for the entire month of March 2025 (68,879 Google searches, 12,593 with an AI Overview). The finding: when an AI Overview was present, users were roughly half as likely to click any traditional search result, and almost never clicked the AI summary's source citations.[7]
AI Overviews suppress click-through — Pew Research, March 2025
Pew Research Center, 900 US adult panelists, 68,879 searches[7]
The standard-SERP click rate is ~15% on Pew's data; with an AI Overview present that roughly halves. Source-citation clicks within the AI Overview itself are essentially negligible — being cited is almost as bad as being skipped entirely.
How AI Overview traffic shows up in your reports
- In GSC: An impression where your URL is shown inside the AI Overview as a citation counts as a normal impression. Google does not yet label AI Overview impressions separately. If you see queries where impressions are stable but clicks are way down — and the queries are factual/informational — AI Overviews are the prime suspect.
- In GA4: Traffic that does originate from an AI Overview citation arrives looking like ordinary organic Google traffic — same source/medium of google / organic. You can't separate it in standard reports. The only signal is that conversion rate often runs higher than average, because the people who do click through after consuming the summary are unusually motivated.
- LLM-direct referrals (ChatGPT, Perplexity, Claude): These do show up in GA4 as referrals — typically chatgpt.com / referral, perplexity.ai / referral, claude.ai / referral. Many small businesses now see 2–5% of total organic-adjacent traffic from these sources. Check Traffic acquisition with the Session source / medium dimension.
What to do about it
The honest answer in 2026 is: not much, from a reporting standpoint. You can't make Google label AI Overview impressions. You can't make AI Overview source-citation clicks happen more often. What you can do is adjust which queries you optimise for and how. Top-of-funnel "what is X" queries are the most aggressively summarised by AI Overviews; bottom-of-funnel comparison and transactional queries ("X vs Y", "buy X near me", "best X for Y") still get clicked. The dashboard treatment is to add a small section that tracks average position vs clicks for your top 20 queries — a widening gap is the AI Overview signal.
A reasonable 2026 baseline
→ Do this now: In GA4 Traffic acquisition with Session source / medium, check whether chatgpt.com / referral, perplexity.ai / referral, or claude.ai / referral appears anywhere in your top 20 sources. If yes, you're already in the LLM-citation game whether you knew it or not.
The Monday-Morning Routine
What 15 minutes a week with this dashboard actually looks like
The whole point of trimming sixty reports down to six is that the resulting routine should fit in a single coffee. Here's what a healthy weekly cadence looks like, start to finish:
- Open your Looker Studio dashboard. Glance at total clicks and total sessions vs the previous 28 days. Up, flat, or down?
- Scan the GSC Queries tab inside the dashboard. Any new top-20 query that wasn't there last week? Any old one that disappeared? Note both.
- Scan the GA4 Landing page panel. Same exercise. Anything new in the top 10? Anything dropped out?
- One-page deep-dive of the week: pick the worst decayer or best new performer and spend 10 minutes understanding why.
- Action item: one thing this week. Refresh a decayed post, fix a cannibalization case, add a missing CTA to a high-traffic / zero-conversion landing page. One thing. Not three.
That's it. Fifteen minutes if your dashboard is set up, no more than three browser tabs, one concrete action. The hardest part is resisting the urge to read more reports — small-business analytics is a discipline problem, not a data problem. The data has always been there; the discipline is to look at the right six things, decide on one fix, and ship it before next Monday.
Once you know what's actually working — which queries, which pages, which conversion paths — the next bottleneck shifts to producing more of what's working. That's a different operating problem than a measurement problem, and it's where AI-assisted publishing tools like News Factory fit in: keeping a content pipeline moving on the topics this dashboard tells you to double down on, so your weekly review has new wins to point at next Monday.