You're spending $5.26 every time someone clicks your Google ad. The average across all industries in 2025 — and for lawyers it's $8.58. For dentists, $7.85. Every. Single. Click. Whether that visitor buys or bounces, the meter keeps running.
Meanwhile, the blog post you published six months ago is still pulling in organic traffic. Zero cost per click. Zero ad spend. But most business owners never calculate what that organic traffic is actually worth in dollar terms — so they treat content as a cost center instead of what it really is: an appreciating asset.
This article puts a dollar figure on every blog post. We'll calculate traffic value versus PPC equivalent, show how content compounds over 12–36 months, break down cost-per-lead by industry, and run the exact math on why a $16.50/month content investment can return thousands. Every number is sourced. Every claim is backed by data.
By the end, you'll know exactly what your content is worth — and what it's costing you to not publish.
The $0 Traffic Myth
Why 'free' organic traffic has a measurable dollar value — and why most businesses ignore it
There's a persistent myth in small business marketing: organic traffic is "free." You don't pay Google per click, so the traffic must cost nothing. This thinking leads to a dangerous blind spot. If you can't put a dollar value on content, you can't justify investing in it. So you don't. And then you wonder why competitors who do publish keep stealing your customers.
Here's the reality. Organic traffic has a precise dollar value — it's the amount you'd have to pay Google Ads for the same visits. SEO tools like Ahrefs and SEMrush calculate this automatically: Traffic Value = Monthly Organic Visits × Equivalent CPC for each keyword. It's the standard metric used across the industry.
Insight
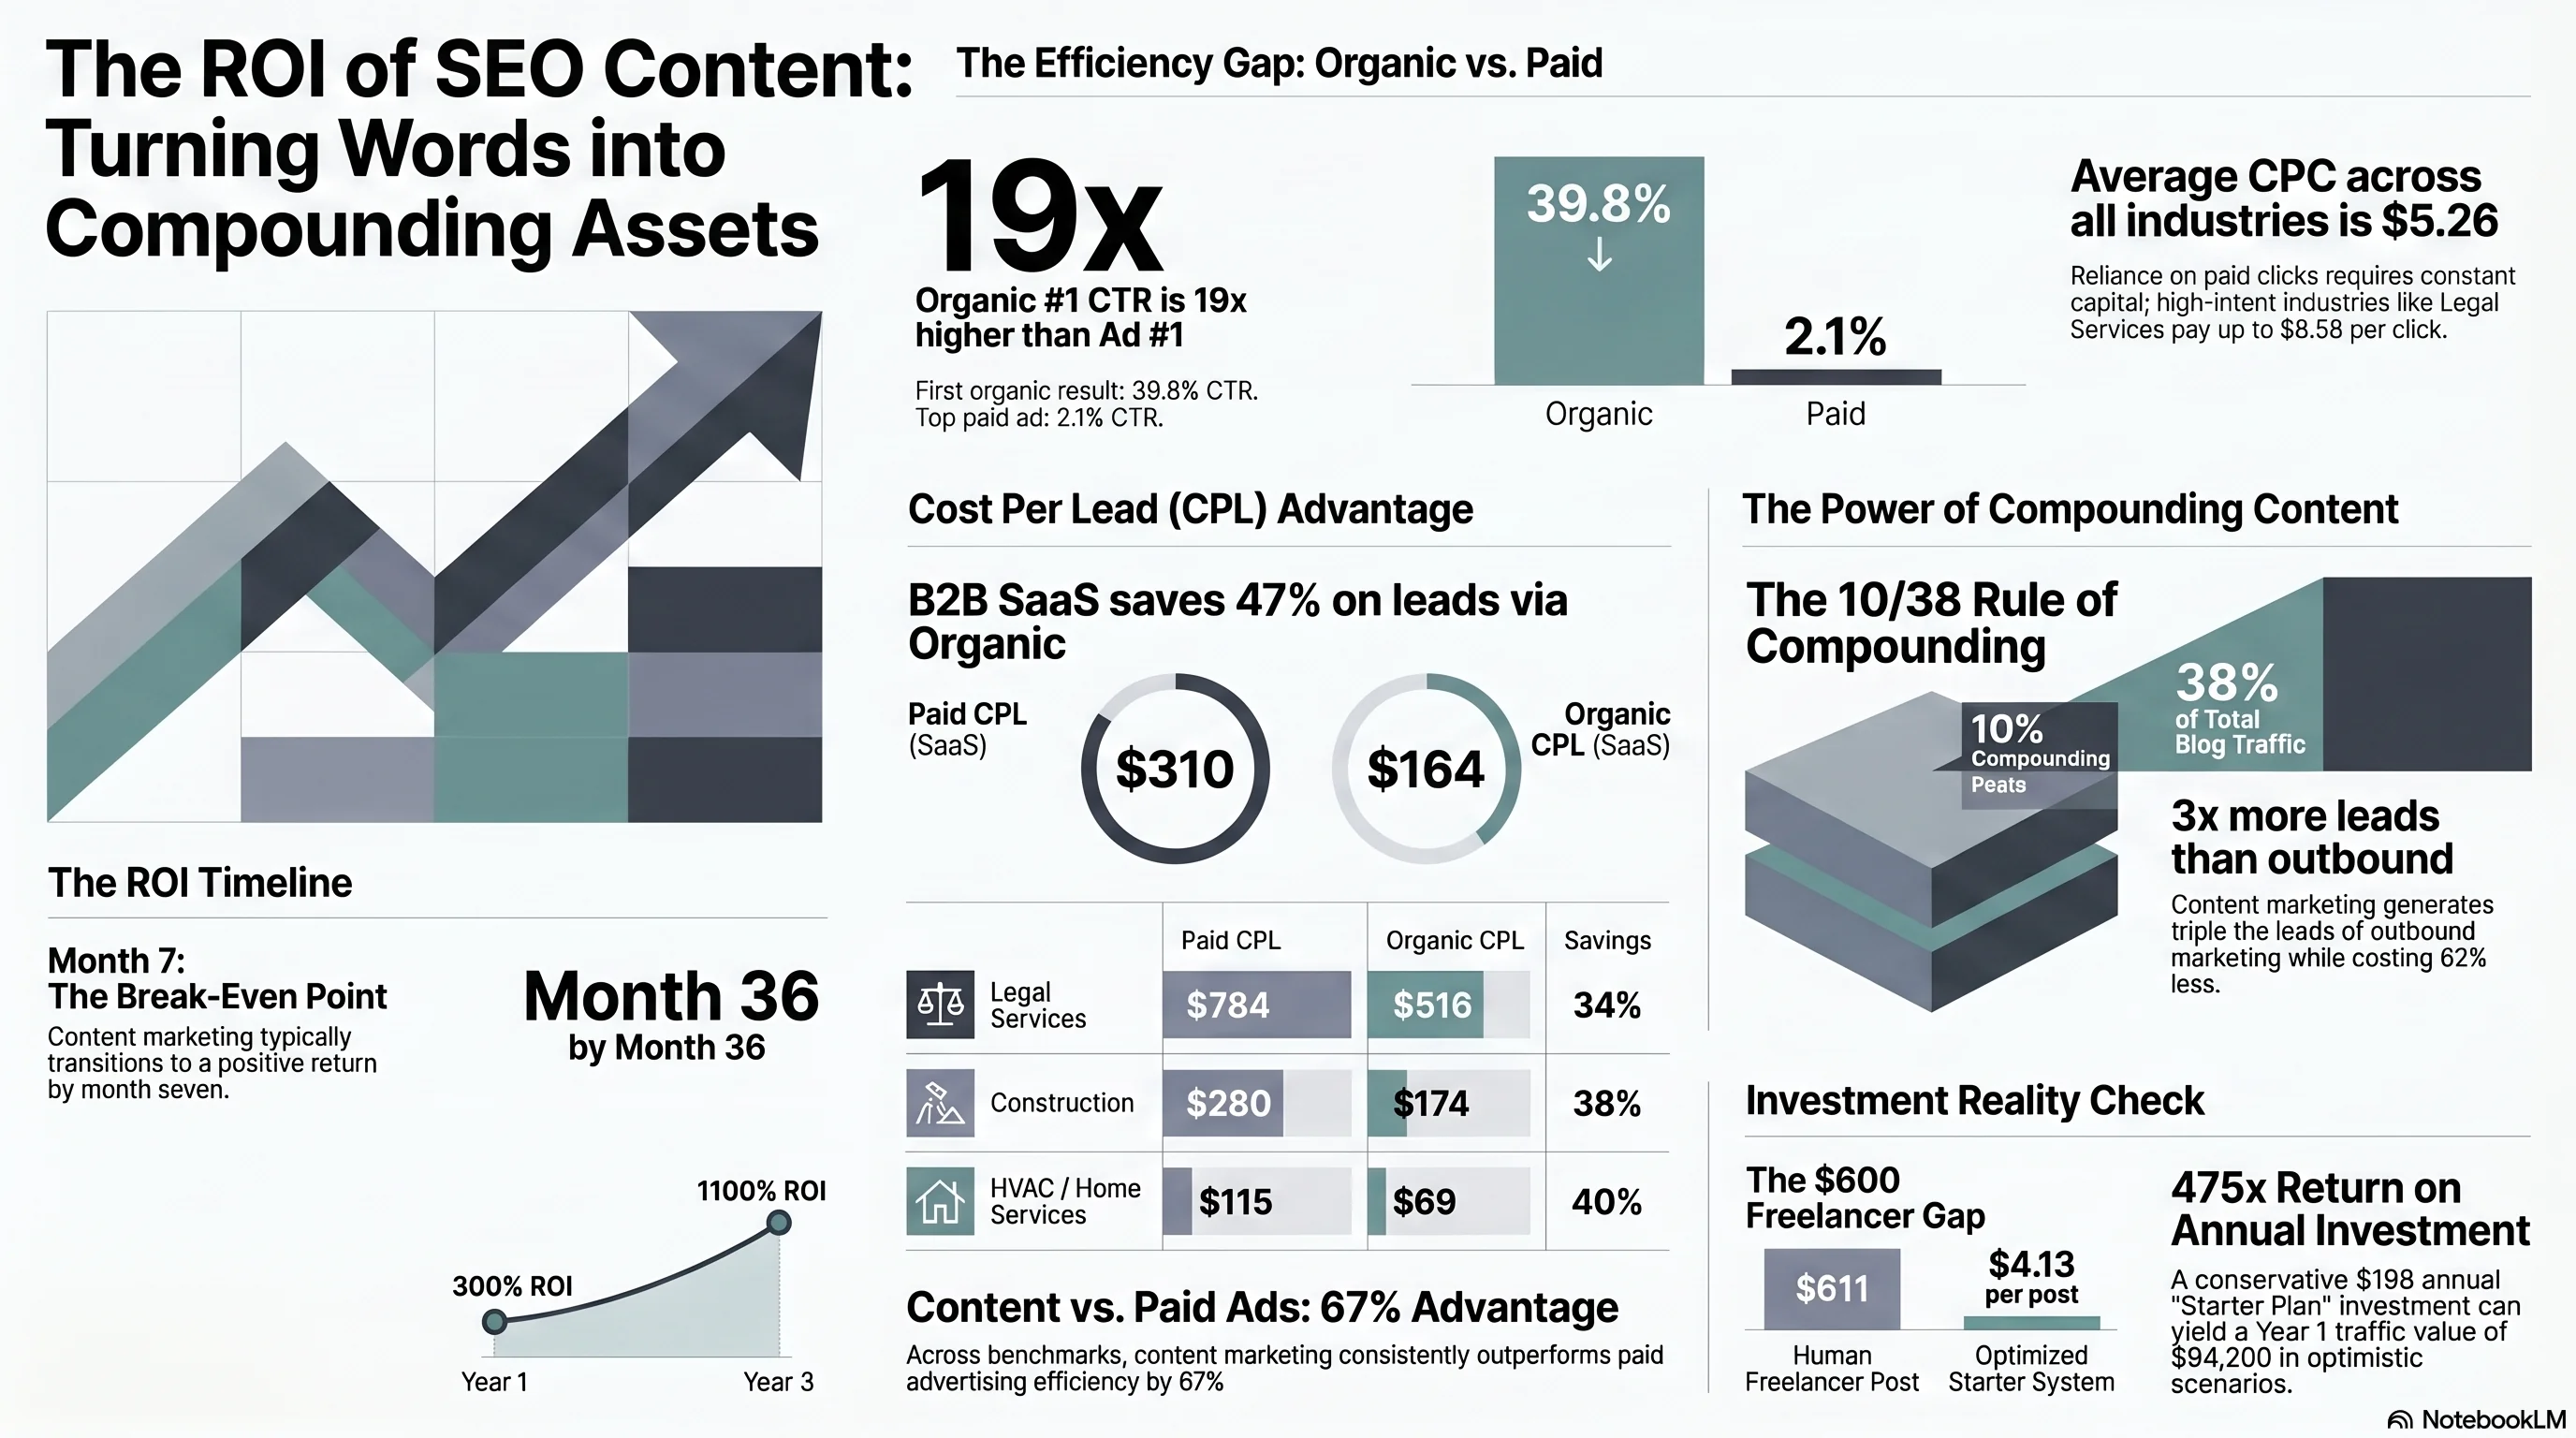
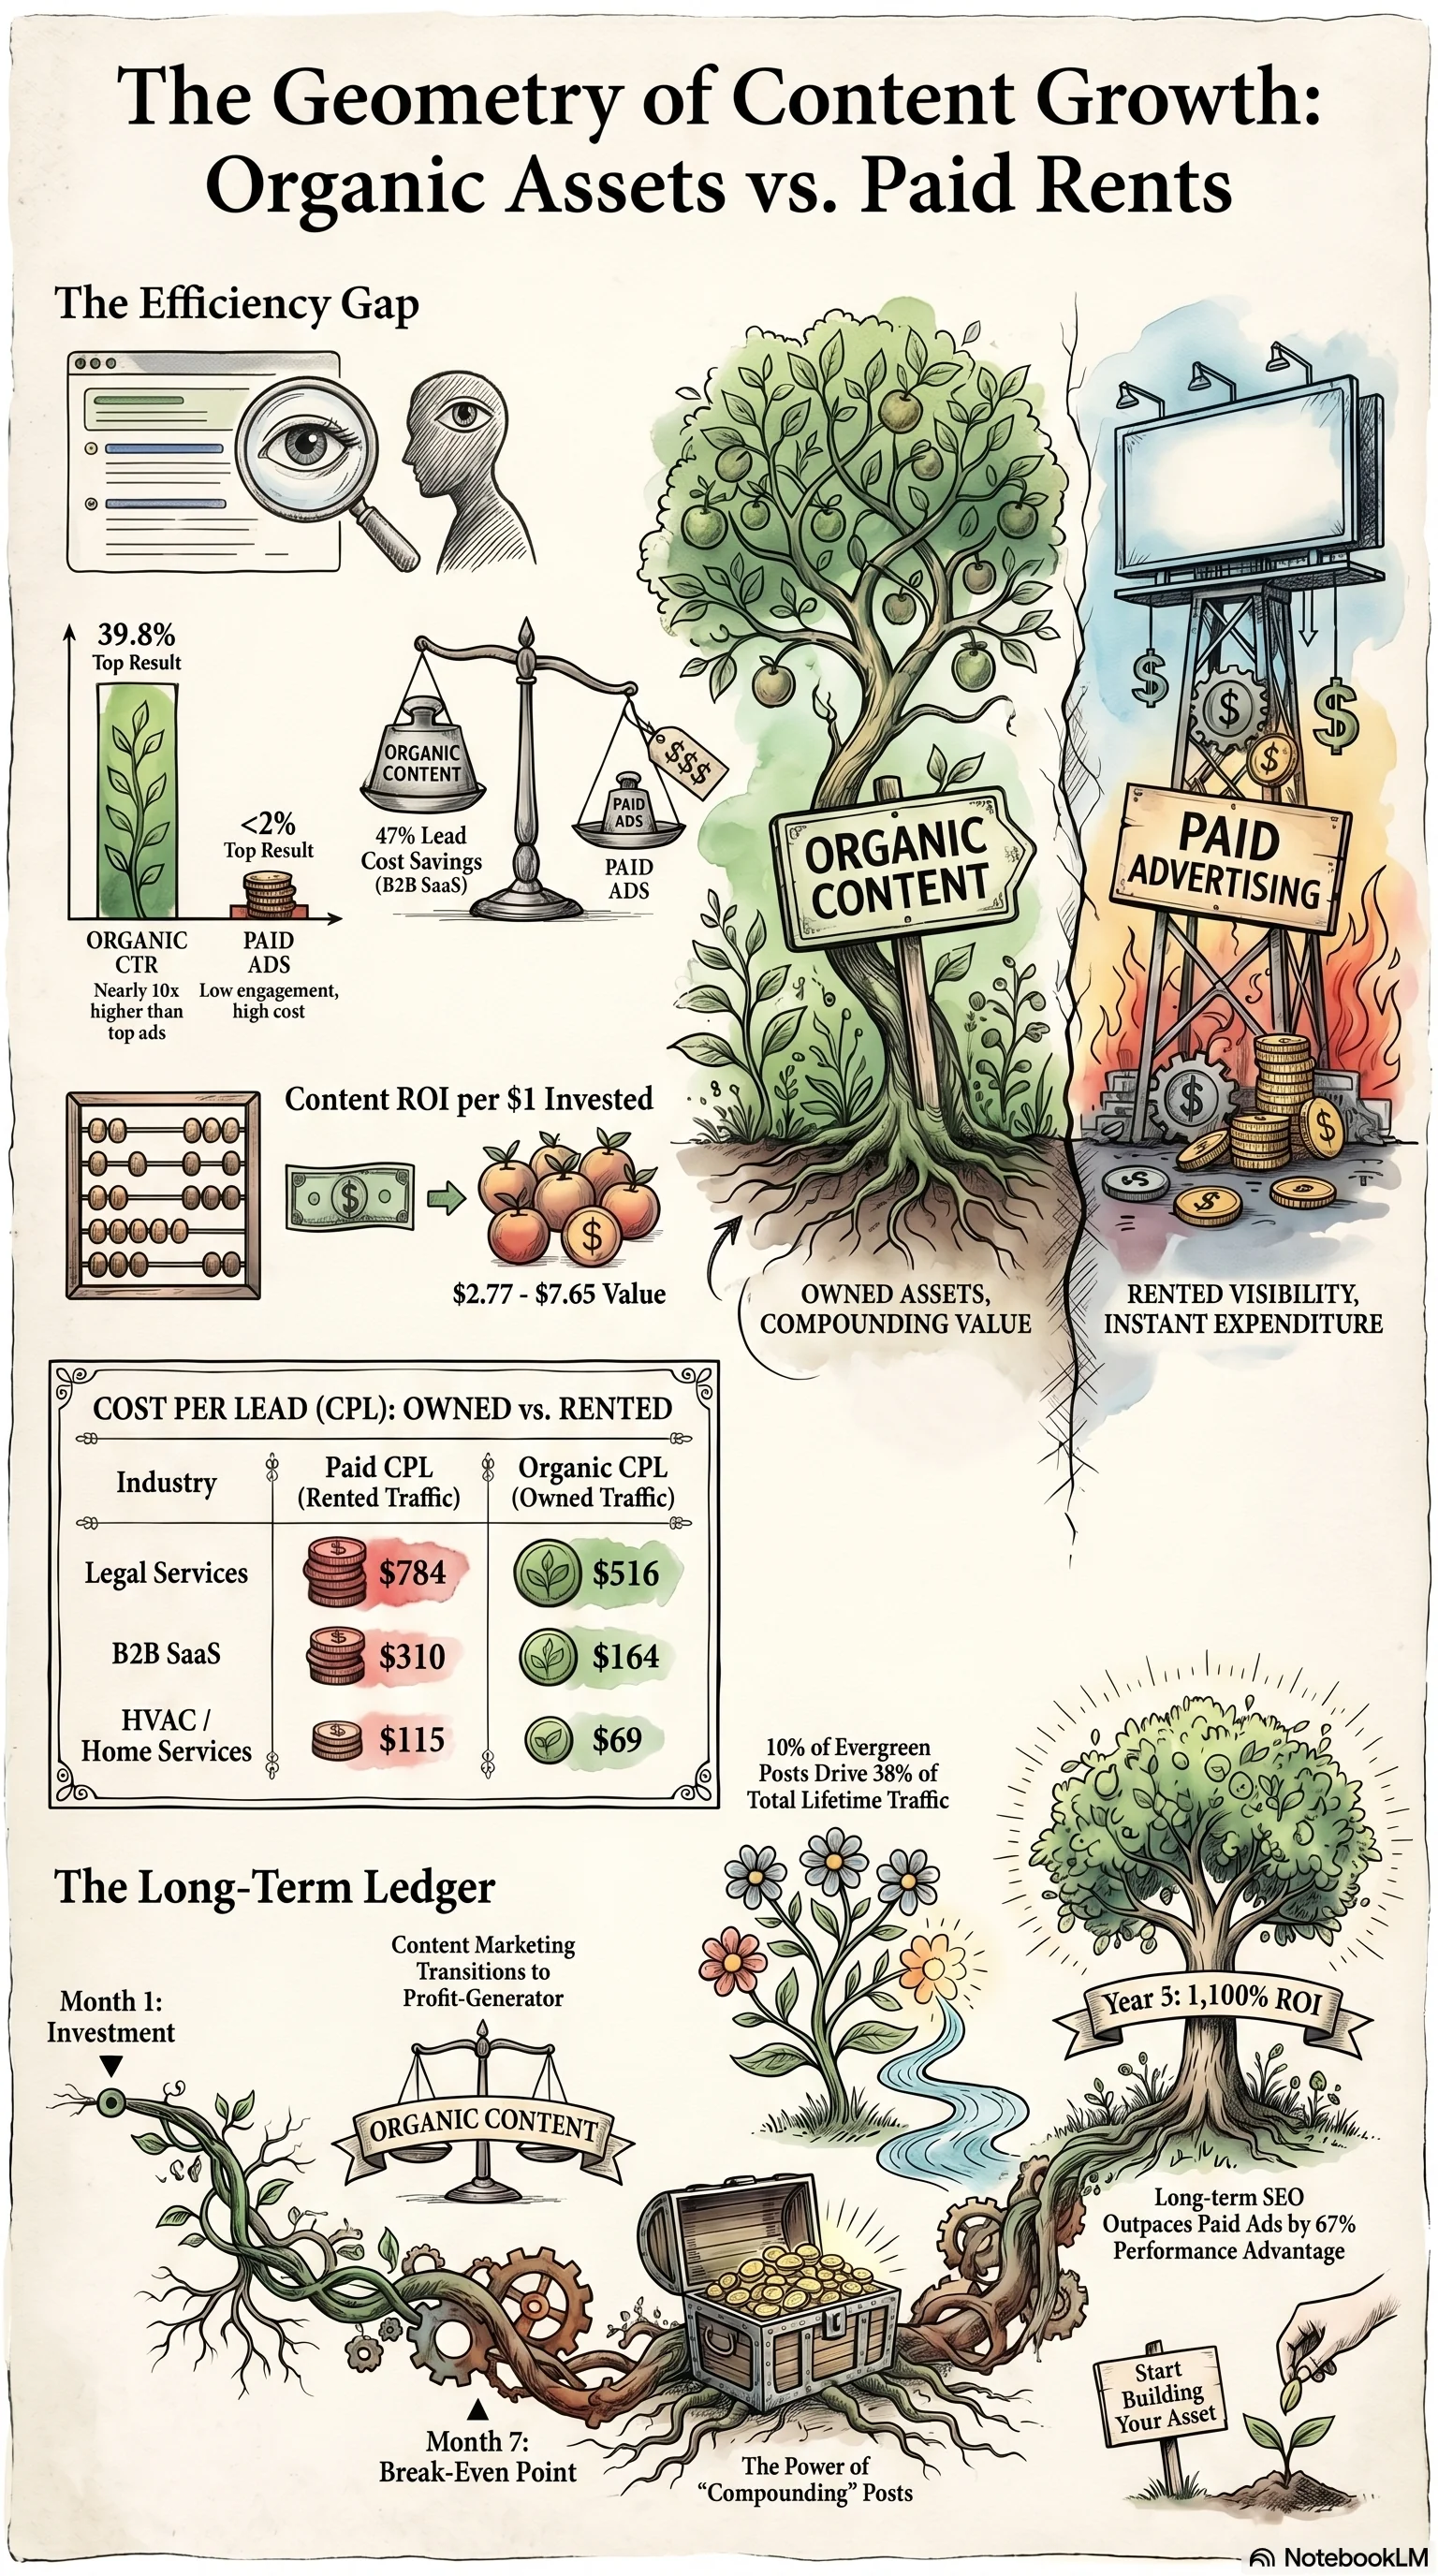
The difference between organic and paid visibility is staggering. The #1 organic result on Google gets a 39.8% click-through rate. The #1 ad position? Just 2.1%. That means organic position #1 captures roughly 19× more clicks than the top ad — and you pay nothing for them.
Organic vs Paid Click-Through Rates
Google search results: organic positions vs ad positions (2026)
Source: First Page Sage, Google CTRs by Ranking Position 2026 [3]
Featured Snippets pull even higher — 42.9% CTR. AI Overviews get 38.9% for the top position. The organic real estate at the top of Google is enormously valuable. Paid ads are increasingly expensive and increasingly ignored.
So when someone tells you organic traffic is "free," correct them: organic traffic is pre-paid. You invest upfront in content creation. Then that content earns returns — measurable, quantifiable returns — for months or years. The question isn't whether organic traffic has value. The question is how much.
What Your Organic Traffic Is Actually Worth
CPC by industry, the traffic value formula, and a real-world example
To calculate what your organic traffic is worth, you need two numbers: how many organic visits you get per month, and what you'd pay per click for those same keywords in Google Ads. Multiply them. That's your traffic value.
Here's what businesses across different industries pay per click:
Average CPC by Industry (Google Ads 2025)
What one click costs in paid search — and what each organic visit saves you
Sources: WordStream/LocaliQ 2025 [1], Focus Digital 2025 [2]
Now let's run a real example. A local dental practice publishes consistent blog content and gets 1,000 organic visits per month to their site. With a dental CPC of $7.85:
💰 Dental Practice Traffic Value Calculation
1,000 organic visits/month × $7.85 CPC = $7,850/month
$7,850 × 12 months = $94,200/year in equivalent PPC spend
That's $94,200 you'd have to write a check to Google for — every year — to get the same traffic.
For a law firm at $8.58 CPC, the same 1,000 visits are worth $8,580/month — over $100,000/year. For a home improvement company at $7.85 CPC, identical math. Even restaurants at $2.05 CPC would see $2,050/month in traffic value from 1,000 organic visits.
Recommendation
And remember: CPC increased for 87% of industries in the last year. Your organic traffic literally becomes more valuable as ad costs rise. Every month you wait to invest in content, the opportunity cost grows.
The Compounding Effect
Why blog posts are assets, not expenses — and how 10% of your content drives 38% of traffic
Here's the data point that changes how you think about content: 10% of blog posts generate 38% of all blog traffic. HubSpot's research team analyzed their entire blog — thousands of posts — and found that a small fraction of posts are "compounding." Instead of decaying after publication like news articles, these posts grow over time. They earn more traffic in month 6 than month 1, and more in month 12 than month 6.
The Compounding Post Paradox
A small fraction of content drives a disproportionate share of results
Source: SmartBug Media / HubSpot Research [9], HubSpot Blog [10]
HubSpot's own blog performed slightly above average — 14% of their posts compounded. These posts are almost always evergreen, how-to, or educational content. Not news. Not hot takes. Not "10 things you didn't know about X." Practical, search-optimized content that answers a question people keep asking.
This is what separates content from advertising. A Google Ad stops generating traffic the second you stop paying. A compounding blog post is more like a rental property — it requires an upfront investment, then generates returns month after month with minimal maintenance.
Insight
Think about what this means for a small business. You don't need hundreds of posts. You need a focused strategy that gives you the best shot at creating compounding content. If you publish 48 posts in a year and 10% compound, that's ~5 posts generating traffic that grows for years. Five posts pulling hundreds or thousands of visits per month — long after you've moved on to other work.
The businesses that understand this treat every blog post as an investment. They track traffic value per post. They update and optimize their top performers. They don't delete old content — they improve it. Because a compounding post from two years ago might be their most valuable marketing asset today.
Content Marketing ROI: The Numbers
Industry benchmarks, break-even timelines, and the case studies that prove it
Let's talk concrete returns. Content marketing ROI ranges from $2.77 to $7.65 for every $1 spent, depending on the source and methodology. The conservative estimate comes from broad industry surveys; the higher number from campaigns with strategic execution. Either way, compare that to paid advertising's average return of $1.80 per $1 spent.
SEO & Content Marketing ROI Benchmarks
Multi-year ROI by channel and industry
Sources: Directive Consulting [11], Averi.ai [8], Stratabeat via Averi.ai [8]
The timeline matters. Content marketing isn't a light switch — it's a snowball. Here's what the data shows:
📈 Content Marketing ROI Timeline
Source: Directive Consulting via Averi.ai [8] and WhiteHat SEO [15]
Month 7: break-even. After seven months of consistent publishing, your content investment pays for itself. Month 12: 300% ROI. By year one, you're tripling your money. Month 36: 1,100% ROI. By year three, every dollar you invested has returned eleven.
Compare that to paid ads: approximately $1.80 per $1 spent, with linear returns. Stop spending, get zero leads. Content compounds. Ads don't.
"Paid ads have linear returns. Stop spending, get zero leads. Content has compound returns… which is why B2B content marketing delivers 844% ROI over three years."— Directive Consulting, B2B Content Marketing ROI Research [11]
The case studies back it up:
- Zapier achieved 454% content marketing ROI — factoring in ALL costs including team salaries, freelancers, and tech stack against revenue from signups.
- Runn.io had a single high-intent blog post account for 15% of the company's total revenue, tracked via HubSpot through return visits and demo requests.
- A B2B software company's interactive ROI calculator generated 15,000 leads in three months at $5/lead — versus $12 for traditional content.
Warning
The Lead Generation Math
3× more leads at 62% less cost — and the cost-per-lead data by industry
Traffic value is one thing. But what about actual leads — people who fill out a form, call your business, or book a consultation? The data here is equally compelling: content marketing generates 3× more leads than outbound marketing and costs 62% less.
Companies with active blogs generate 67% more monthly leads than those without. Businesses publishing 16+ posts per month experience 4.5× more leads and 3.5× more traffic. Companies that blog actively generate over 10× more leads than those that don't.
Lead Generation Impact of Content
How consistent publishing translates to measurable lead growth
Sources: Demand Metric [14], HubSpot via RankTracker [6], CausalFunnel [12]
But the cost-per-lead comparison by industry is where it gets really interesting. Here's what businesses pay for a lead through paid channels versus organic content:
| Industry | Paid CPL | Organic CPL | Savings |
|---|---|---|---|
| Legal Services | $784 | $516 | 34% |
| Financial Services | $761 | $555 | 27% |
| Healthcare | $401 | $320 | 20% |
| B2B SaaS | $310 | $164 | 47% |
| Construction | $280 | $174 | 38% |
| HVAC / Home Services | $115 | $69 | 40% |
| eCommerce | $98 | $83 | 15% |
Source: First Page Sage, Average CPL by Industry 2026 [4]
B2B SaaS sees the biggest gap: $310 per lead through paid versus $164 through organic — a 47% savings. HVAC and home services save 40%. Even eCommerce, with the smallest differential, saves 15% per lead through organic.
Insight
And these organic leads convert to paying customers. 58% of B2B marketers report increased sales and revenue directly from content marketing. Content typically contributes 30–60% of the overall sales pipeline for B2B businesses. The leads don't just show up — they convert.
The $16.50/Month ROI Calculation
The exact math for a News Factory Starter plan — conservative and optimistic scenarios
Let's put everything together with a specific scenario. News Factory's Starter plan costs $16.50/month and produces approximately 4 SEO-optimized blog posts per month through AI-assisted content creation. What does the ROI look like?
First, let's compare the cost per post:
Cost Per Blog Post: Three Approaches
What you'd pay for the same content through different channels
Sources: Engage Coders 2025 survey [13], News Factory pricing
At $16.50/month for ~4 posts, that's $4.13 per post — versus $131 for typical AI-assisted content, or $611 for a human freelancer. That's 148× cheaper than the industry average for human-written content.
Now the ROI scenarios:
📊 Conservative Scenario (100 organic visits/month)
4 posts/month × 12 months = 48 posts in year 1
Total organic traffic: 100 visits/month (very conservative)
Average CPC (all industries): $5.26
Monthly traffic value: 100 × $5.26 = $526/month
Annual traffic value: $6,312
Annual investment: $16.50 × 12 = $198
ROI = ($6,312 − $198) ÷ $198 × 100 = 3,088%
🚀 Optimistic Scenario (1,000 organic visits/month)
48 posts total — if 10% compound, that's ~5 compounding posts
5 compounding posts × 200 visits/month each = 1,000 visits/month
Using home services CPC ($7.85) as example:
Monthly traffic value: 1,000 × $7.85 = $7,850/month
Annual traffic value: $94,200
Annual investment: $198
ROI = ($94,200 − $198) ÷ $198 × 100 = 47,475%
🎯 Lead Conversion Scenario
1,000 visits/month × 2.4% conversion rate = 24 leads/month
If even 1 lead/month converts to a $500+ customer:
Annual revenue from content leads: $6,000
Annual investment: $198
ROI = ($6,000 − $198) ÷ $198 × 100 = 2,929%
And that's just one customer per month. For service businesses where a single client is worth $2,000–$50,000, one lead from one post can pay for years of the Starter plan.
Recommendation
Compare the alternatives: hiring a freelancer to produce 4 posts/month would cost roughly $2,444/month ($611 × 4). Using typical AI tools and a human editor costs about $524/month ($131 × 4). The Starter plan at $16.50/month isn't a rounding error on those budgets — it eliminates them entirely.
71% of brands spend under $1,000 monthly on content marketing and still achieve significant results. At $16.50/month, you're investing less than a lunch — and getting a content operation that, according to every benchmark we've seen, should return multiples of that investment within the first year.
Your ROI Action Plan
Five steps to start measuring — and maximizing — your content ROI today
Knowing the numbers is one thing. Acting on them is another. Here's a five-step framework to start tracking and improving your content ROI immediately:
Step 1: Calculate Your Current Traffic Value
Open Google Analytics. Find your monthly organic sessions. Multiply by your industry's average CPC from the chart above. That's your baseline traffic value — the number you're going to grow.
Step 2: Identify Your Compounding Candidates
Look at your existing content. Which posts still get traffic months after publication? Those are your compounders. Double down on that content format and topic type. Update them with fresh data, better visuals, and stronger internal linking.
Step 3: Set Up Lead Attribution
Connect your blog to your CRM or contact form. Tag leads by source page. After 90 days, you'll know exactly which posts generate leads — and you can calculate revenue per post. This is how Runn.io discovered one post was driving 15% of their revenue.
Step 4: Commit to Consistent Publishing
The data is unanimous: companies publishing 16+ posts/month see 4.5× more leads. You don't need to hit 16 right away — but you need consistency. 4 posts per month is enough to start the compounding engine. The key is never going silent.
Step 5: Track Monthly and Think in Quarters
Content ROI breaks even around month 7. Don't evaluate your program at month 2 and quit. Track traffic value monthly, but make strategy decisions quarterly. The businesses earning 844% three-year ROI didn't get there by giving up in week six.
The math is clear. Content marketing returns $2.77–$7.65 for every dollar invested. Organic traffic saves you $5.26+ per click. Compounding posts build value for years. Leads from content cost 2–5× less than paid channels. And at $16.50/month, the barrier to entry has never been lower.
The businesses seeing 702–844% ROI from content aren't doing anything magical. They're publishing consistently, targeting the right keywords, creating genuinely useful content, and giving it time to compound. That's the formula. The only question is whether you start this month or keep paying $5.26 per click indefinitely.
If you want to stop guessing and start building a content operation that pays for itself many times over, News Factory handles the entire pipeline — research, writing, optimization, and publishing — starting at $16.50/month. The ROI math speaks for itself.
References & Sources
Article also available in: