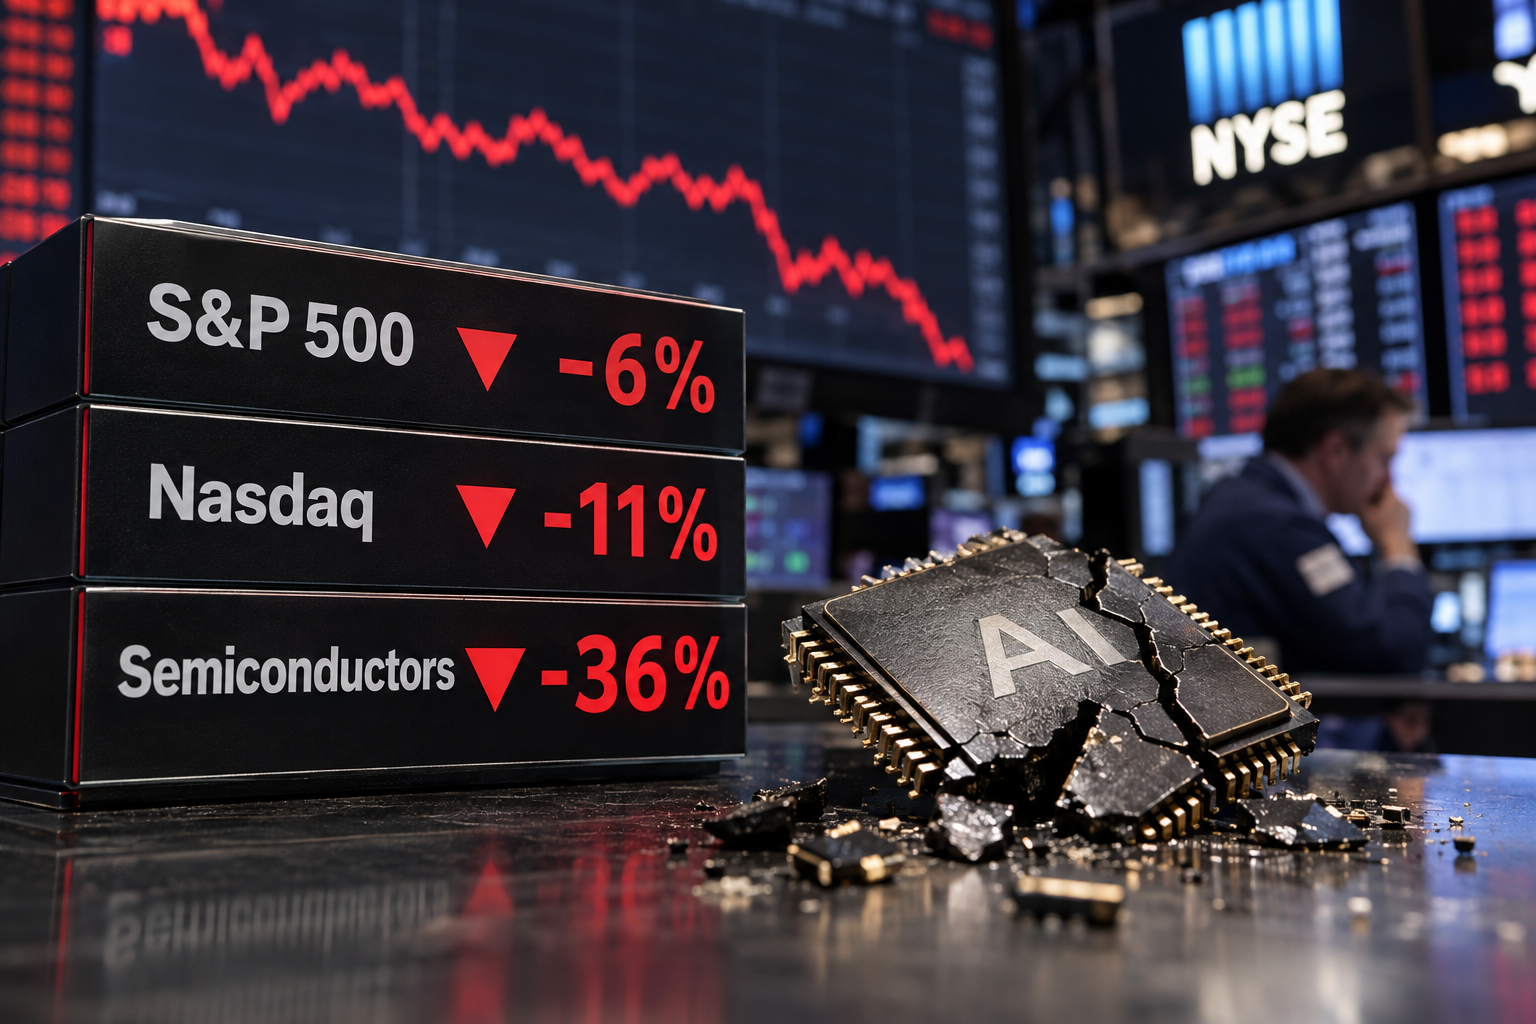
How far has the S&P 500 fallen from its record?
The S&P 500 is about 6% below its record close, a drop that looks mild next to the worst stock market falls of the past century. The broader index has not been hit as hard as the technology sector, where the Nasdaq is down 11% and U.S. chip stocks have lost 36% of their value.
The slide has drawn plenty of alarming headlines. But measured against history, the S&P 500 decline is small. Among the 56 falls of 6% or more from a record close since 1928, four in five never reached a 20% decline, according to data compiled from daily closes on Yahoo Finance.
The index closed at its low point on Thursday, November 5, when it dropped 4.4%. That was its worst single day since April 4, 2025. As of the close on November 6, the S&P 500 had spent 23 trading days below its record, which was set on October 6.
How do chip stock losses compare with past crashes?
Chip stocks tell a harsher story. The PHLX Semiconductor index is 36% below its record from June 22, a decline roughly as deep as the one the sector suffered during the Covid crash, when it fell 35%. The Nasdaq, which carries far more technology weight than the S&P 500, is down 11% from its own peak.
Technology now makes up about a third of the S&P 500, far more than it did during the 1929 or 1973 downturns. That means a sell-off led by tech companies moves the broader index more than it would have in earlier decades.
How long do stock market recoveries usually take?
Recovery times vary widely depending on the episode. After the dot-com bust, the S&P 500 took 7.2 years to get back to its record close, while the Nasdaq took 15.1 years and chip stocks took 17.7 years. The 2008 financial crisis left the Nasdaq and chip stocks still below their 2000 highs, so the data treats 2008 as part of the dot-com fall for those two indexes. Recoveries after the 1987 crash and the April 2025 drop were much quicker, at 1.9 years and 4 months respectively for the S&P 500.
Those recovery figures are worst-case scenarios for an investor who bought at the record high. They use price changes alone. Once dividends are reinvested, most past recoveries took less time.
The AI slide has not yet produced a recovery. Its current measure, dating from the October 6 record, shows the S&P 500 down 6% after one month, the Nasdaq down 11% and chip stocks down 36% after 4.5 months.
Cet article a été rédigé avec l'assistance de l'IA.
News Factory APP - actualités agentiques pour booster votre SEO et AEO.